|
|
You are here: Foswiki>Boost2010 Web>Boost2011>ComparisonsPlan>Results>TopEfficiencies (12 Oct 2011, ChristopherVermilion)Edit Attach
New efficiency plots (12/10)
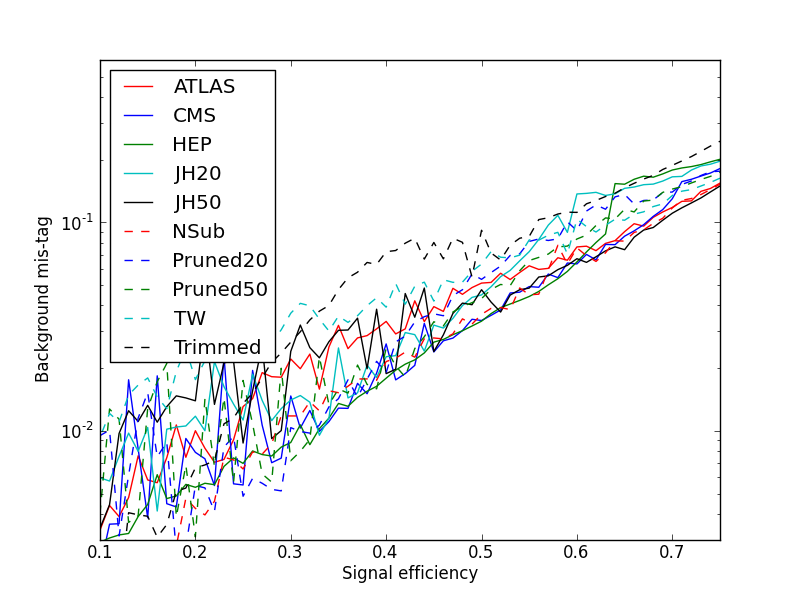
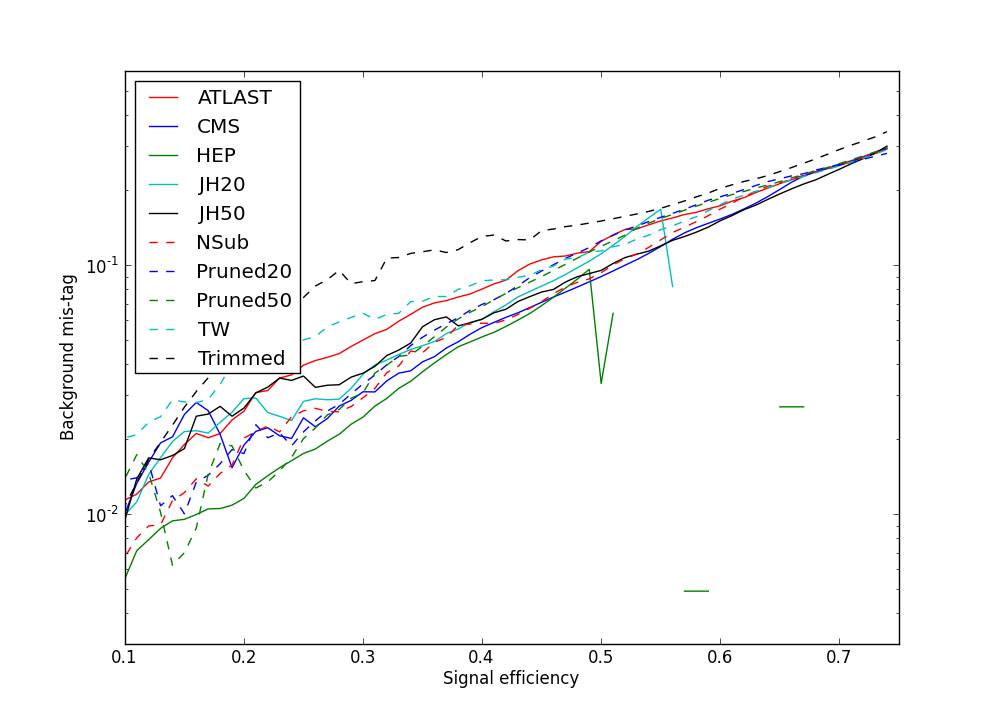
Here are some new plots. Some notes: TW is "Thaler and Wang", cutting on kT mass and min mW mass, then zcell (see last year's report). JH20 and JH50 are the Hopkins tagger using last year's 20% and 50% efficiency points; likewise Pruned20 and Pruned50. Trimmed uses the "optimized" parameters from the grooming section of last year's report. Nsubjettiness cuts on anti-kT mass and tau3/tau2. In all cases the input parameters of the method, if any, are fixed.- Efficiencies for all pTs, Herwig events. Even with 60K events, the statistics from TMVA are pretty choppy.
- Same curves, but now apply a five-point moving average to smooth out the noise:
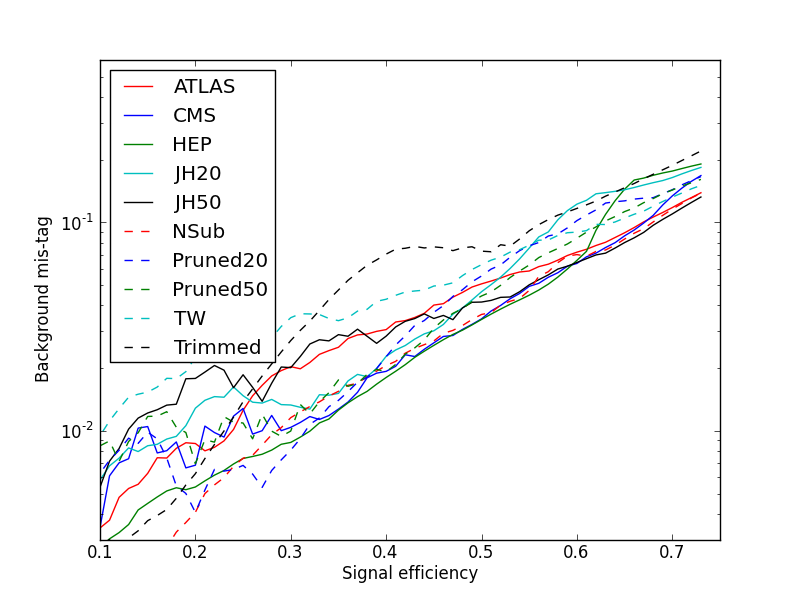
- Efficiencies for pT 500-600, Herwig events, five-point moving average. The kinks at the end are artifacts of the average.
-
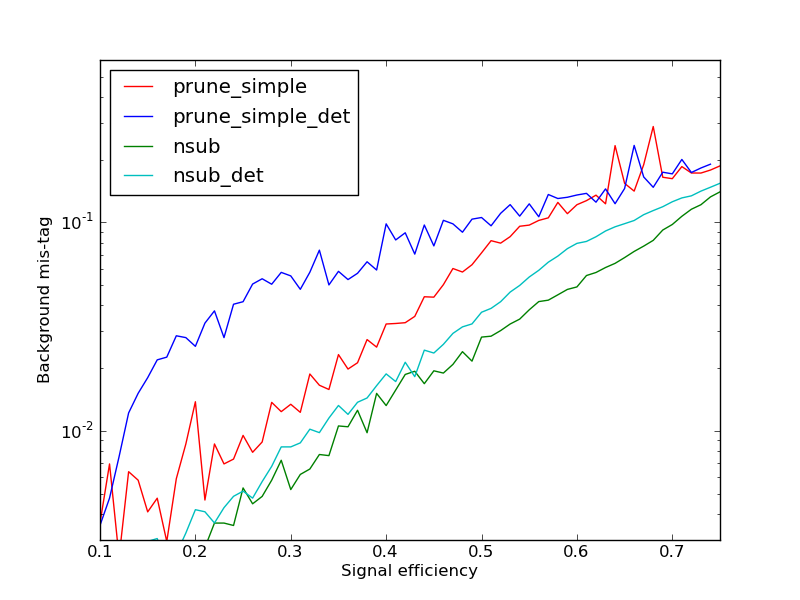
- Efficiencies for pT 500-600, Herwig events, incl. detector, five-point moving average:
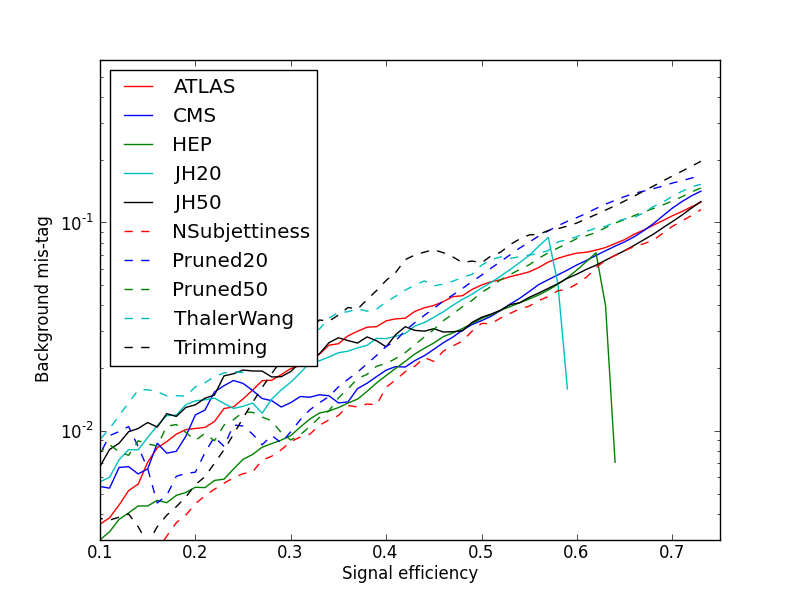
- Efficiencies for pT 500-600, Sherpa events, three-point moving average. Sherpa events are matched samples (see write-up in paper).

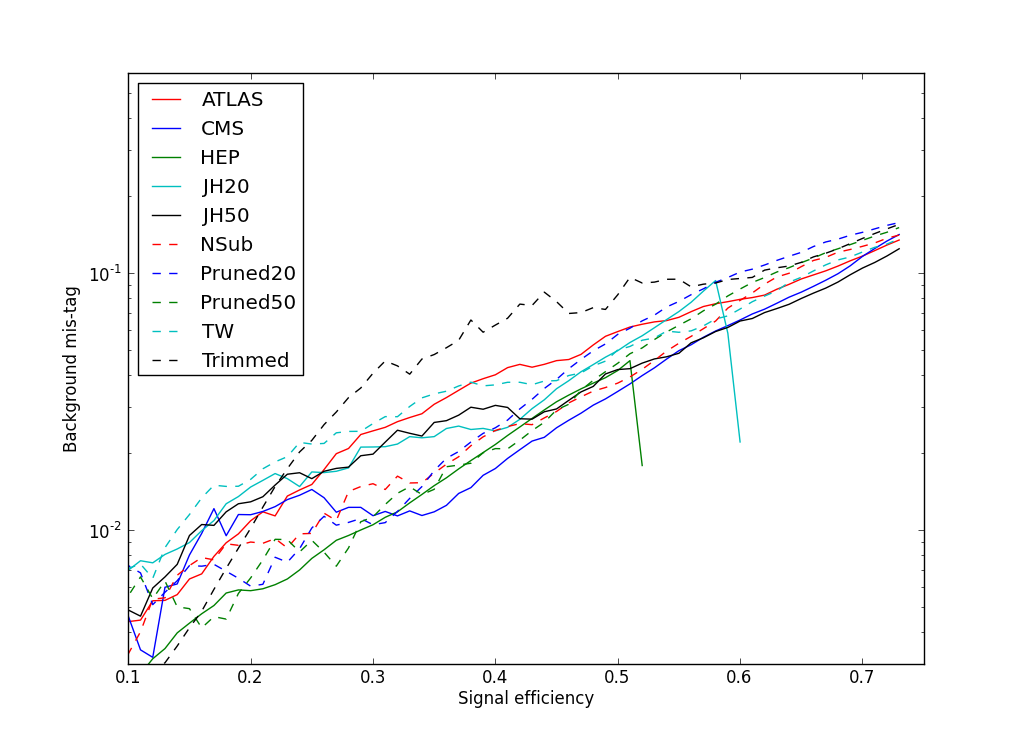
- Efficiencies for pT 500-600, Sherpa events, incl. detector, three-point moving average:
Plots (updated 20/9)
- Efficiency curves, for 500-600 pT:

- Efficiency curves, for 500-600 pT, with PL's detector sim:

Older plots
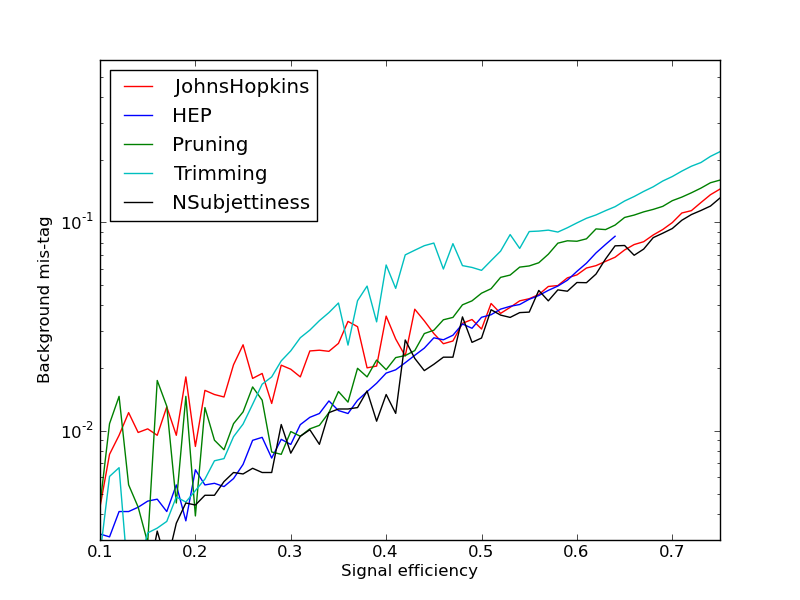
- This plot compares the HEP top tagger, the Hopkins (JH) tagger, N-subjettiness, and pruning. Only for pruning are the analysis parameters scanned (zcut and Dcut). For JH this did not seem to help (should double check). N-subjettiness has no input parameters, just measurements. I have not implemented access to analysis parameters for the HEP tagger in SpartyJet, and I'm not even sure what should be scanned.
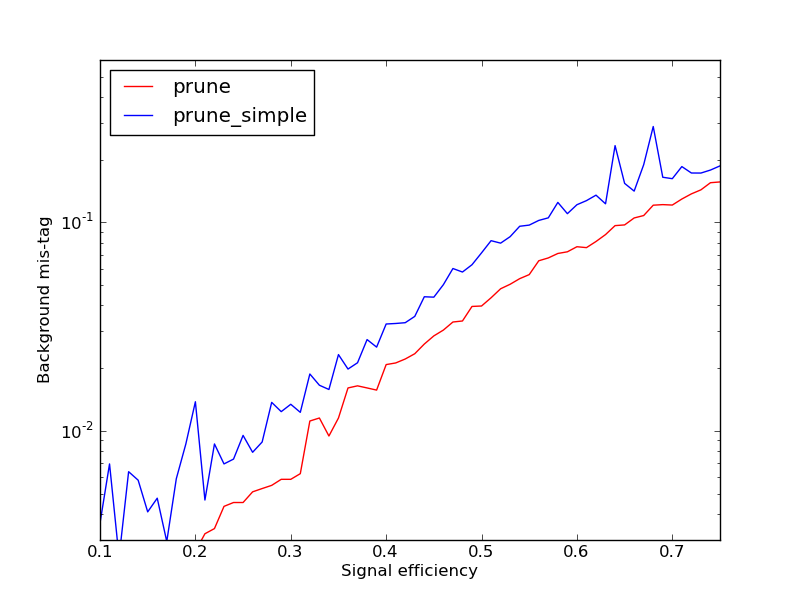
This plot shows the importance of parameter optimization for pruning. "prune_simple" refers to no optimization; "prune" includes a scan of zcut and Dcut. This improves performance by about a factor of two.


| I | Attachment | Action | Size |
Date | Who | Comment |
|---|---|---|---|---|---|---|
| |
prune_optimization_compare.png | manage | 38 K | 29 Aug 2011 - 20:16 | ChristopherVermilion | Efficiency curve for pruning, with and without parameter optimization |
| |
eff_compare_500_det.png | manage | 62 K | 20 Sep 2011 - 14:54 | ChristopherVermilion | Efficiency curves, for 500-600 pT, with PL's detector sim |
| |
eff_detector_compare.png | manage | 65 K | 29 Aug 2011 - 20:16 | ChristopherVermilion | Efficiency curves for pruning and N-subjettiness, with and without detector sim |
| |
eff_compare_500.png | manage | 77 K | 20 Sep 2011 - 14:56 | ChristopherVermilion | Efficiency curves, for 500-600 pT |
| |
effs_compare_500.png | manage | 77 K | 20 Sep 2011 - 14:58 | ChristopherVermilion | Efficiency curves, for 500-600 pT (take 2) |
| |
herwig_5pt.png | manage | 85 K | 12 Oct 2011 - 20:27 | ChristopherVermilion | Efficiencies for all pTs, Herwig events, five-point moving average |
| |
herwig_500_5pt.png | manage | 86 K | 12 Oct 2011 - 20:28 | ChristopherVermilion | Efficiencies for pT 500-600, Herwig events, five-point moving average |
| |
sherpa_500_det_3pt.png | manage | 93 K | 12 Oct 2011 - 20:29 | ChristopherVermilion | Efficiencies for pT 500-600, Sherpa events, incl. detector, three-point moving average |
| |
herwig_500_det_5pt.png | manage | 101 K | 12 Oct 2011 - 20:28 | ChristopherVermilion | Efficiencies for pT 500-600, Herwig events, incl. detector, five-point moving average |
| |
sherpa_500_3pt.png | manage | 106 K | 12 Oct 2011 - 20:29 | ChristopherVermilion | Efficiencies for pT 500-600, Sherpa events, three-point moving average |
| |
herwig.png | manage | 111 K | 12 Oct 2011 - 20:27 | ChristopherVermilion | Efficiencies for all pTs, Herwig events |
Edit | Attach | Print version | History: r3 < r2 < r1 | Backlinks | View wiki text | Edit wiki text | More topic actions
Topic revision: r3 - 12 Oct 2011, ChristopherVermilion
Ideas, requests, problems regarding Foswiki? Send feedback